The Global Environmental Flow Calculator (GEFC)
The Global Environmental Flow Calculator (GEFC) is a software package for desktop rapid assessment of Environmental Flows (EFs). The EF estimation technique in GEFC is using monthly time step series reflecting “natural” / unregulated flow conditions and its corresponding Flow Duration Curve (FDC)- a cumulative distribution function of flows. The FDC is represented by 17 percentage points on the probability (X) axis. EFs aim to maintain an ecosystem in, or upgrade it to some prescribed or negotiated condition - “Environmental Management Class (EMC).” The higher the EMC, the more water is needed for ecosystem maintenance and more flow variability needs to be preserved. Six EMCs are used in GEFC, ranging from “Unmodified” to “Critically Modified.” Each EMC is represented by its unique FDC. The FDC for each class is determined by the lateral shift of the original reference FDC to the left along the probability (X) axis by one percentage point. Each EMC is effectively an EF scenario. The EMC best suited for the river in question may be selected-based on expert judgment. A FDC established for each EMC can be converted into an EF time series. Details of the method are described in Smakhtin and Anputhas (2006). The EF estimation in the GEFC package includes 4 subsequent steps:
 |
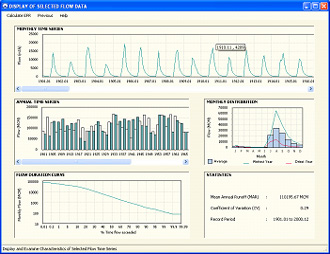 |
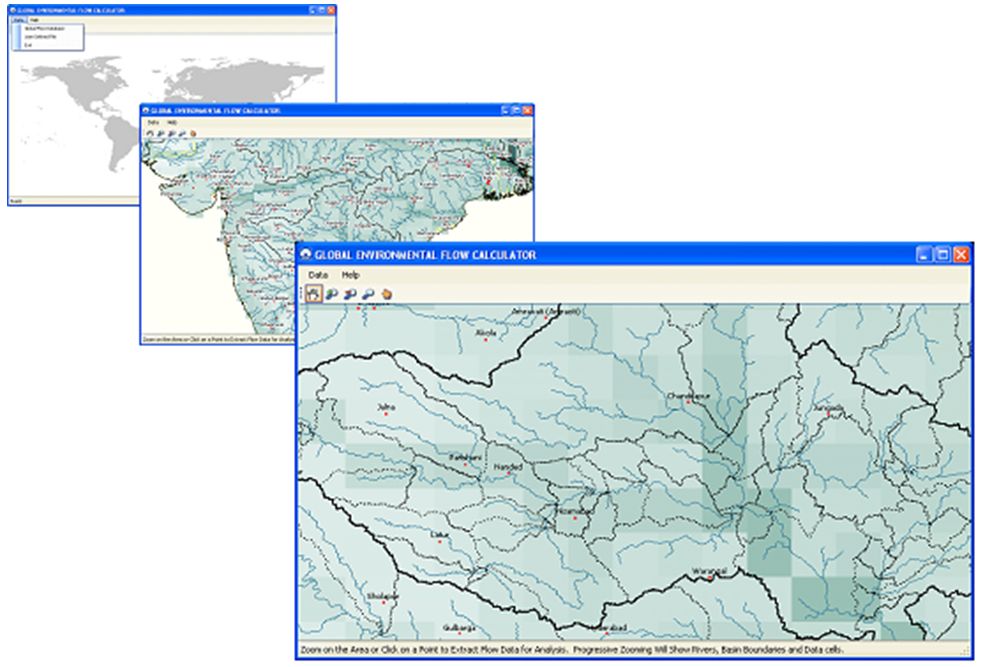
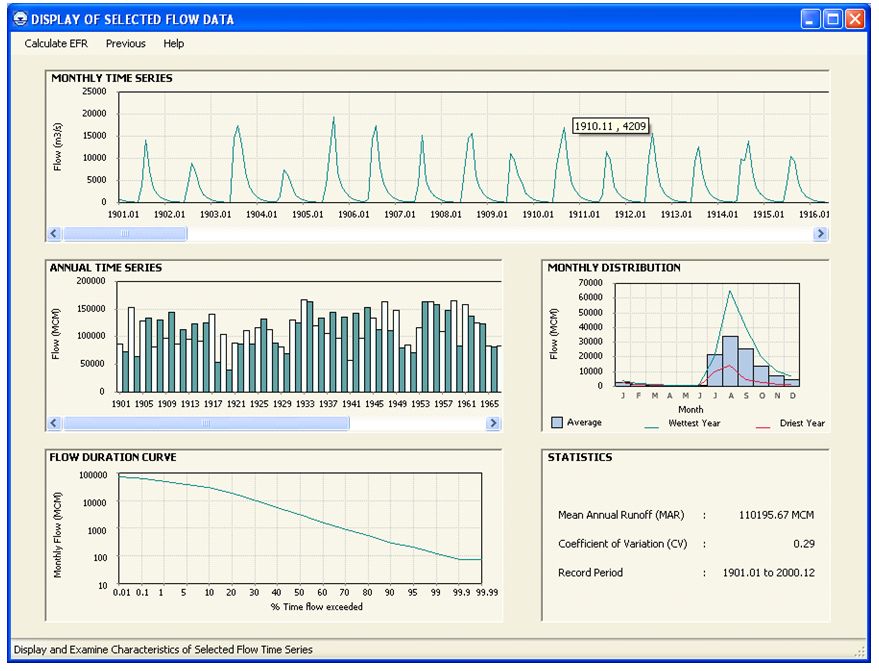
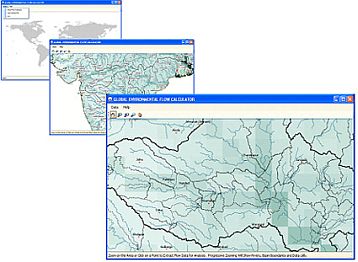
Figure 1 (a) The illustration of progressive zooming in the Global Environmental Flow Calculator from the main screen to the individual river basins and data cells seen at a higher zoom level (b) Display of the actual selected monthly flow data and other hydrological characteristics / time series calculated from it. |
Select a Data Source
Two options are available for selecting a data source: The “User Defined File” and the “Global Flow Database”. The first option will perform all further calculations using the flow time series data file (in a specified text format) provided by the user. The “Global Flow Database” option provides access to an in-built simulated global flow database supplied with the package as default hydrological data. These data are monthly discharges (in m3/s) at a resolution of 0.5 degree. Each 0.5o cell in the grid holds discharge time series for the catchment upstream of the cell. Each time series spans a period of 100 years (from 1901 to 2000). A powerful and user-friendly map interface acts as the gateway to the database and allows the selection of a source time series for any part of the world to be made by clicking on a point (nearest grid cell) of interest. Progressive zooming on the map will expose individual data cells and several global GIS coverages (Figure 1(a)).
Display Hydrological Characteristics
Once a user defined file or a grid cell with data is selected, the main hydrological characteristics of the selected flow time series will be displayed in a new screen (Figure 1(b)). The displayed hydrological characteristics include: monthly time series, aggregated annual time series, monthly flow distributions (long-term average as well as for the driest and wettest years in the available record), a period-of-record FDC and some basic flow statistics.
Calculate EFs
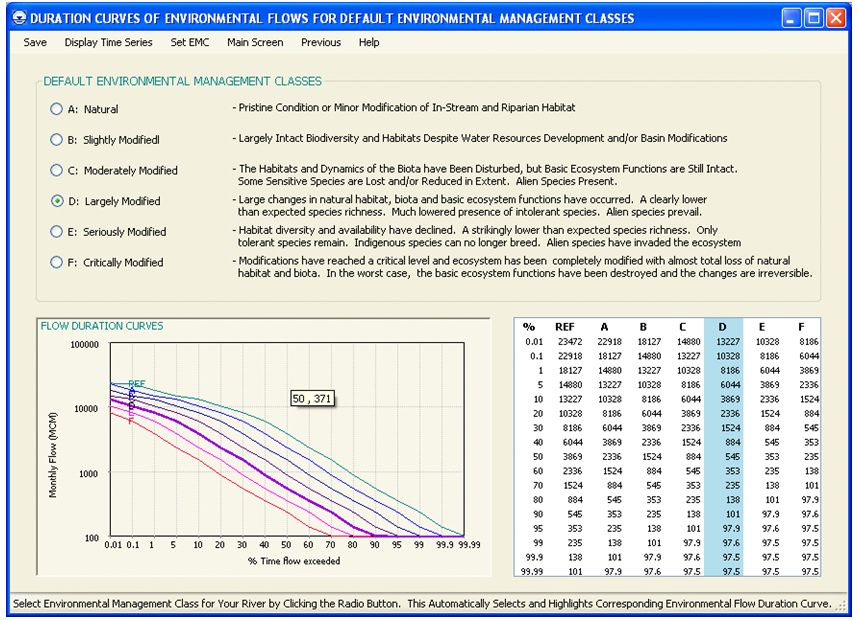
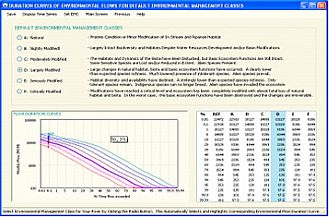
The GEFC calculates the FDC for natural reference conditions and for each EMC subsequently, plotting them all on the same screen (Figure 2(a)). In addition, flow values corresponding to the 17 fixed percentage points are tabulated. The user can select the most suitable EMC for the river in question, or examine the implications of different EMCs on EFs.
Display Estimated Reference and Environmental Monthly Flow Time Series
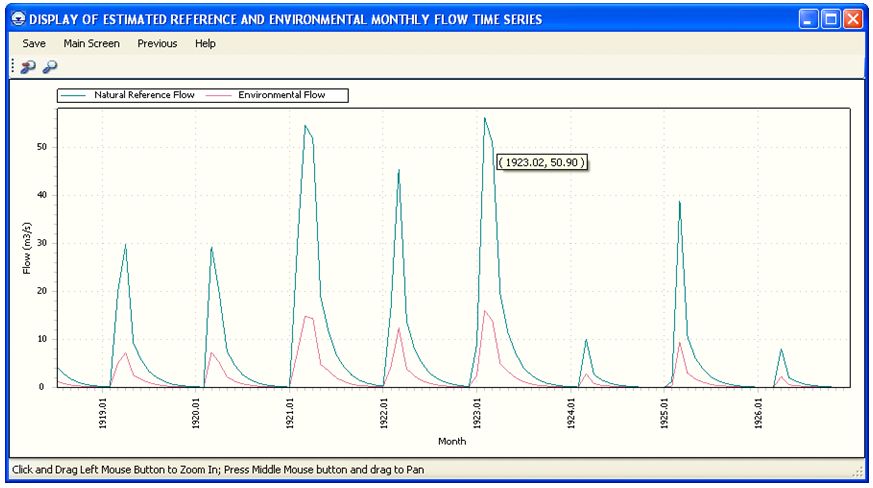
Monthly flow time series from selected FDC are generated using a non-linear spatial interpolation procedure, developed earlier. Both the reference and environmental flow time series are displayed in an interactive graph with facilities for panning and zooming (Figure 2(b)).
 |
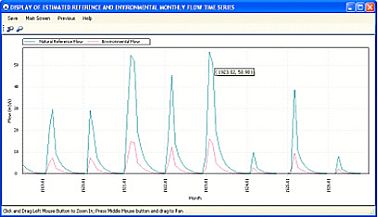 |
Figure 2 (a) The graphed and tabulated Reference and Environmental Flow Duration Curves (b) Display of Estimated Reference and Environmental Flow Time Series |
Detailed ‘Help’ facility is built into the package. GEFC is coded in Visual Basic 2005. A free copy of the software (on DVD, which also includes the simulated global flow database) may be obtained from Mrs Nishadi Eriyagama ([email protected]). GEFC is a product of the collaborative project between IWMI and the Water Systems Analysis Group of the University of New Hampshire (UNH - http://www.wsag.unh.edu/). Enquiries on the package may be directed to Dr. Vladimir Smakhtin ([email protected]).
|