


WHO Collaborating Centre for Health Promoting Water Management and Risk Communication
Head: Prof. Dr. Thomas Kistemann
IHPH Institute for Hygiene and Public Health University of Bonn
Sigmund-Freud-Str. 25
D-53105 Bonn
Germany
Dr. Ina Wienand
Tobias Frechen
Tel. +49-228/ 287-19517
Fax. +49-228/ 287-19516
E-mail:
Tobias Frechen
Christoph Hoeser (MSc GIS)
Prof. Thomas Kistemann
Dr. Andrea Rechenburg
Dr. Ina Wienand (MSc GIS)
The Atlas on Water and Health (www.waterandhealth.eu) makes every effort to ensure that the material contained in its web site is current, complete and correct. Despite this errors and mistakes cannot be completely ruled out. www.waterandhealth.eu does not accept liability for the relevance, accuracy or completeness of the information and material offered in its web site unless the mistake occurred intentionally or through gross negligence. This refers to any loss, additional costs or damage of any kind suffered as a result of any use of any material in this web site.
www.waterandhealth.eu is not responsible for any contents linked or referred to from his pages. If any damage occurs by the use of information presented there, only the author of the respective pages might be liable, not the one who has linked to these pages. Furthermore www.waterandhealth.eu is not liable for any postings or messages published by users of discussion boards, guestbooks or mailinglists provided on his page.
www.waterandhealth.eu intended not to use any copyrighted material for the publication or, if not possible, to indicate the copyright of the respective object. The copyright for any material created by www.waterandhealth.eu is reserved by:
Any duplication or use of objects such as images, diagrams or texts in other electronic or printed publications is not permitted without the agreement of www.waterandhealth.eu.
Where you are invited to submit personal information (e-mail address, names, postal addresses) the submission of this information is purely voluntary. www.waterandhealth.eu expressly declares that the information submitted will not be passed on to third parties.
This general disclaimer is part of the material offered in www.waterandhealth.eu web site. If any of the terms and conditions should be determined invalid by reason of the relevant laws then the remaining terms and conditions shall remain in full effect.
The objective of the Protocol on Water and Health is to promote at all appropriate levels [...] the protection of human health and well-being [...] through improving water management, including the protection of water ecosystems, and through preventing, controlling and reducing water-related diseases. (Art. 1, Protocol on Water and Health). The country profiles contain selected summary information on water and health that are available globally and important in the context of the Protocol on Water and Health. Such information helps to give a better insight into the conditions concerning water resources, water supply and sanitation as well as water-related diseases of the specific countries.
Data source is WaterWiki (http://www.waterwiki.net) with reference to other sources. It comprises the following data (Tab. 1):
Tab. 1: Sources and explanation for the background data
| Data | Description |
|---|---|
| Total population | Total number of inhabitants |
| Population density | Number of inhabitants per km² |
| Total area (km²) | Total area of the country in km² |
| GDP (PPP) per Capita (US $) | Gross domestic product (GDP) at purchasing power parity (ppp) per capita = the value of all final goods and services produced within a nation in a given year divided by the average (or mid-year) population for the same year Source: CIA World Factbook - Central Intelligence Agency (data of different years), Wikipedia |
| HDI | Human Development Index: A composite index measuring average achievement in three basic dimensions of human development: a long and healthy life, access to knowledge and a decent standard of living Source: Human Development Report 2009 of the UNDP |
Data source is WaterWiki (http://www.waterwiki.net) with reference to other sources. It comprises the following data (Tab. 2):
Tab. 2: Sources and explanation for the water resources data
| Data | Description |
|---|---|
| Water surface (km² or m²/ha) | Total area of water in the country in km² or m²/ha |
| Coastline (km) | Length of coastline of the country in km |
| Land use: Irrigated (km²) | The area of cultivated land which is artificially supplied with water in km² Source: CIA World Factbook - Central Intelligence Agency (data of different years) |
| Precipitation (mm/year) | Long-term average (over space and time) of annual endogenous precipitation (produced in the country) in depth. Source: Aquastat - FAO's Information system on water and agriculture |
| Renewable water (km³) | This entry provides the long-term average water availability for a country in cubic kilometres of precipitation, recharged ground water, and surface inflows from surrounding countries. Source: CIA World Factbook - Central Intelligence Agency (data of different years) |
| Total water withdrawal(km³/year) | Annual total water withdrawal is the gross amount of water extracted from any source, either permanently or temporarily, for a given use. It can be either diverted towards distribution networks or directly used. It includes consumptive use, conveyance losses, and return flow. Data are presented as the most recent value (typically 1998-2002 in the Aquastat database, assigned here to 2000). Source: Earth trends - the environmental information portal from the Word Resources Institute (WRI); Source: Aquastat - FAO's information system on water and agriculture |
| Water withdrawal for domestic use (%) | Percent of water withdrawals used for domestic purposes refers to the proportion of total water withdrawals that is allocated to domestic uses, which include drinking water plus water withdrawn for homes, municipalities, commercial establishments, and public services. All water withdrawals are allocated to one of three categories; agricultural, domestic, or industrial. Data are presented as the most recent value (typically 1998-2002 in the Aquastat database, assigned here to 2000 - the middle year of this range). Source: Earth trends - the environmental information portal from the Word Resources Institute (WRI); Source: Aquastat - FAO's information system on water and agriculture |
| Water withdrawal per capita (m³) | Annual per capita water withdrawals are calculated by using 2000 population estimates (or other appropriate year from the UN Population Division. Source: Earth trends - the environmental information portal from the Word Resources Institute (WRI); data are taken from Aquastat - FAO's information system on water and agriculture and Population Division of the Department of Economic and Social Affairs of the United Nations Secretariat, 2005. Source: World Population Prospects: The 2004 Revision |
Data source: Joint Monitoring Programme (JMP) for water supply and sanitation from WHO and UNICEF, data from 1990 and 2006
The access to drinking water and to basic sanitation is measured by the Millennium Development Goals (MDG) indicators:
The JMP is required to use these indicators as the basis of its estimates. As definitions of "access" can vary widely within and among countries and regions, and as JMP is mandated to report at global level and across time, it has created a set of categories for "improved" and "unimproved" facilities that are used to analyse the national data on which its trends and estimates are based.
Divided into total population in 1,000 and urban population in % of total population, data from 1990 and 2006
The percentage of improved and unimproved total, urban or rural drinking water supplies. An improved drinking-water source is defined as one that, by nature of its construction or through active intervention, is protected from outside contamination, in particular from contamination with faecal matter. To allow for international comparability of estimates, JMP uses the following classification to differentiate between "improved" and "unimproved" drinking-water sources. Since its development in the 2008 report, this ladder allows JMP to show what is considered improved and unimproved in a more refined way.
Piped water on premises: Piped household water connection located inside the user's dwelling
Public taps or standpipes, tube wells or boreholes, protected dug wells, protected springs or rainwater collection
unprotected dug well, unprotected spring, cart with small tank/drum, surface water (river, dam, lake, pond, stream, canal irrigation channels) and bottled water
The percentage of improved and unimproved total, urban or rural sanitation facilities. For MDG monitoring, an improved sanitation facility is defined as one that hygienically separates human excreta from human contact. To allow for international comparability of estimates, JMP uses the following classification to differentiate between the use of improved sanitation and use of "non-improved" sanitation. A more refined way of classification is:
ensure hygienic separation of human excreta from human contact
Unimproved sanitation facilities: do not ensure hygienic separation of human excreta from human contact. Unimproved facilities include pit latrines, without a slab or platform, hanging latrines and bucket latrines
Source: JMP Homepage: http://www.wssinfo.org/en/123_definitions2.html
The collected health data comprise information in the context of water-related diseases, which are defined in the Protocol as any significant adverse effects on human health, such as death, disability, illness or disorders, caused directly or indirectly by the condition, or changes in the quantity or quality, of any waters (Protocol on Water and Health, Art. 2, Definitions).
Data source: Health for all-database, August 2009
Age standardized death rates (SDR) diarrhoeal diseases under 5 years per 100,000 population, data from 1999 to 2008
Age standardized death rates are calculated using the direct method, i.e. they represent what crude rate would have been if the population had the same age distribution as the European standard population, as follows (Tab. 3):
Tab. 3: Method of the calculation of age standardized death rates
| Age group (years) | European standard population |
|---|---|
| 0 | 1,600 |
| 1 - 4 | 6,400 |
| 5 - 9 | 7,000 |
Source: http://data.euro.who.int/hfadb/help/Technical notes.htm
Data source: Centralized Information System for Infectious Diseases, June 2009
Morbidity of primary diseases: Absolute number of cases per country, data from 1999 to 2009: Cholera, bacillary dysentery (Shigellosis), enterohemorrhagic Escherichia coli (EHEC), viral Hepatitis A, and typhoid fever.
Data source: Centralized Information System for Infectious Diseases (CISID), June 2009
Morbidity of emerging diseases: Absolute number of cases per country, data from 1999 to 2009: Campylobacteriosis, cryptosporidiosis, giardiasis and legionellosis
The Atlas of Water and Health encompasses available data which are relevant in the context of the Protocol on Water and Health. Data for every country of the WHO Region Europe and available years can be presented with the Atlas on one hand as thematic animated maps (map applet, bonus maps applet) and on the other hand as two different types of factsheets (factsheet applet). The processed data are captured from existing databases, like the Joint Monitoring Programme (JMP), the Health for all-database and the Centralized Infectious Diseases Information System (CISID) and consolidated in one database. The main applets of the Atlas are shown in Fig. 1.

Fig. 1: Main applets of the Atlas of Water and Health
By clicking on the map applet (yellow underlined), the map window appears:
The Atlas presents thematic maps on (Fig. 2):
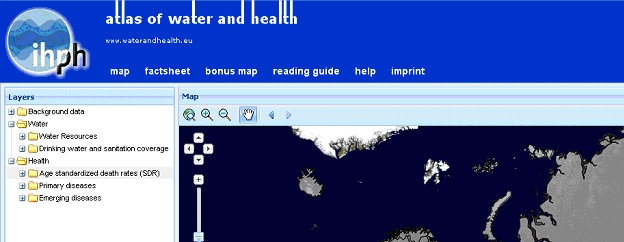
Fig. 2: Selectable folders in the map
By clicking on the background folder, the selectable thematic maps appear (Fig. 3):
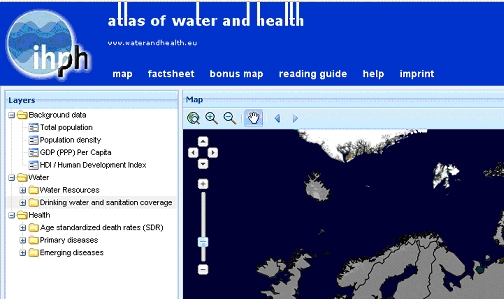
Fig. 3: Selectable thematic maps of the background folder in the map applet
By clicking on the water folder and the water resources folder, the selectable thematic maps appear (Fig. 4):
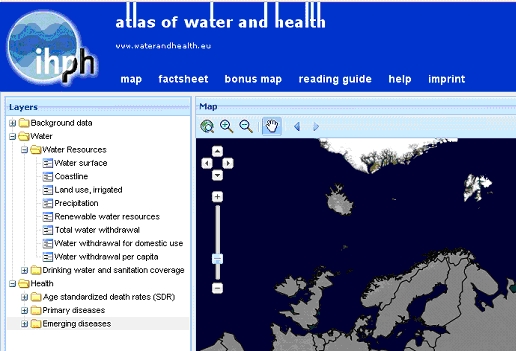
Fig. 4: Selectable thematic maps of the water/ water resources folder in the map applet
The selected thematic map (here water surface map) appears in the map window (Fig. 5):
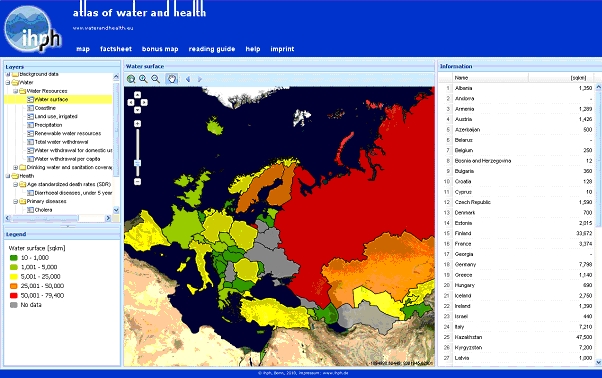
Fig. 5: Thematic map of the total water surface of WHO European Region countries
Additional information of a specific country is provided by clicking on the country in the thematic map. After clicking on the country map the selected country border is highlighted in yellow. In the information window (right side) the country name and the data are also highlighted.
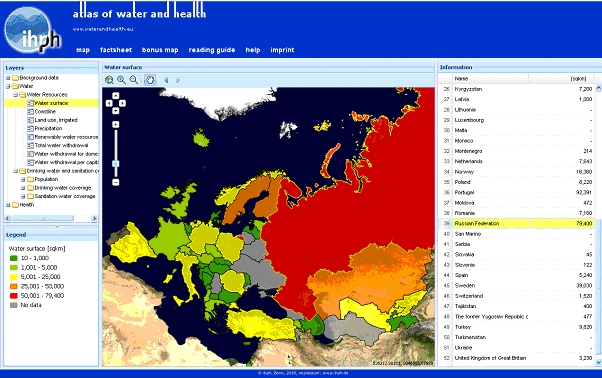
Fig. 6: Selection of countries for getting additional information
In this example, the border of Russian Federation is highlighted in yellow after clicking on the country in the thematic map. In the information window the country name and the data of Russian Federation are also highlighted.
The drinking water and sanitation folder comprises thematic maps with regard to drinking water and sanitation coverage (in %) (Fig. 7).
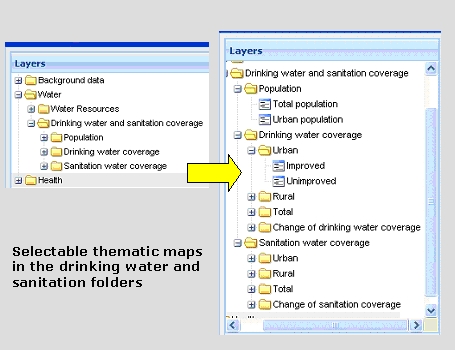
Fig. 7: Selectable thematic maps in the drinking water and sanitation folders
The drinking water and sanitation maps represent the current data of the Joint Monitoring Programme (JMP), i.e. the percentage of improved or unimproved total, urban and rural drinking water supplies and sanitation facilities. Changes of drinking water and sanitation coverage (in %) from 1990 to the current status are visible by clicking on the changes tap.
The health-folder comprises standardized disease rates (SDR) of diarrhoeal diseases from children less than 5 years per 100,000 population as well as current maps on primary and emerging diseases (Fig. 8).
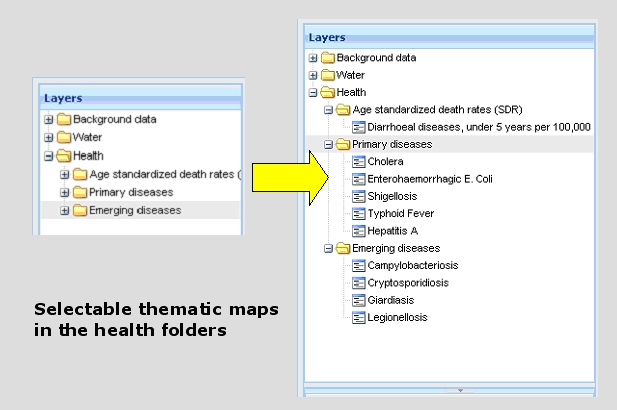
Fig. 8: Selectable thematic maps in the health folders
In the factsheet applet background data as well as water and health data are presented in two different ways (Fig. 8):
There are two ways to generate a country factsheet (Fig. 9):
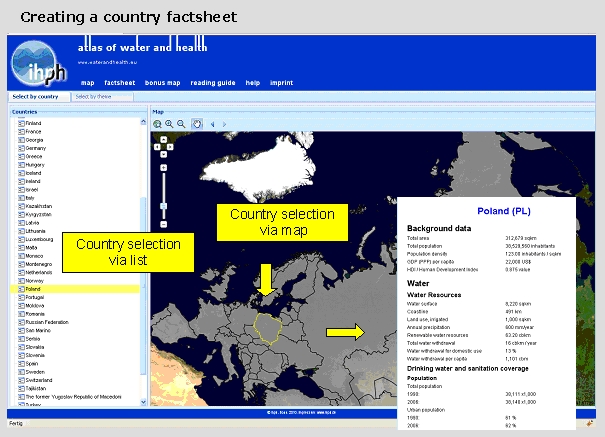
Fig. 9: Creating a country factsheet
The country factsheet comprises water and health data, which are subdivided according to the Atlas categories:
It will also be possible to create graphics of the selected diseases in order to visualize the changes of the number of cases over time.
The thematic factsheet comprises a specific topic of water and health for all countries and all existing years. The thematic folders are arranged according to the folders in the map applet (see Fig. 2). By clicking for example on campylobacteriosis in the folder emerging diseases, the absolute number of campylobacteriosis cases for every country and for all existing years (1999-2008) are shown in the thematic factsheet (Fig. 10). Different years are selectable by clicking on the "+"-Symbol next to "year". Sorting of countries or data is provided by clicking on the country or data tab (here cases).
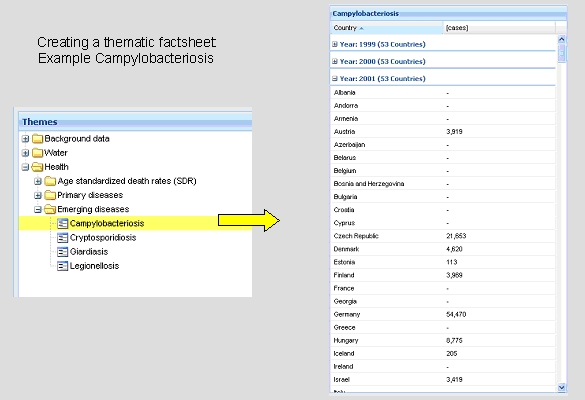
Fig. 10: Thematic factsheet of Campylobacteriosis cases
Graphics with health data for every year with all existing countries will be added for advanced visualization. This will be realized in the revised version of the Atlas of Water and Health.
With the bonus map applet a cartogram (value-by-area map) is presented, in which the area of a country is scaled in proportion to the thematic mapping variable (Fig. 13).
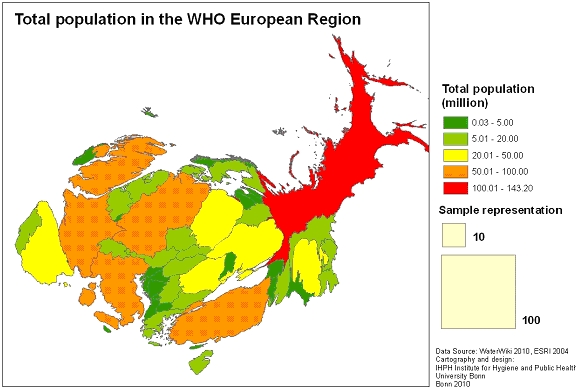
Fig. 11: Map of water surface per km² in the Bonus map applet
The bonus map applet is not yet implemented in the in the Atlas of Water and Health. This will be realized in the next revised Atlas version.
The implementation of the bonus maps is in progress
